
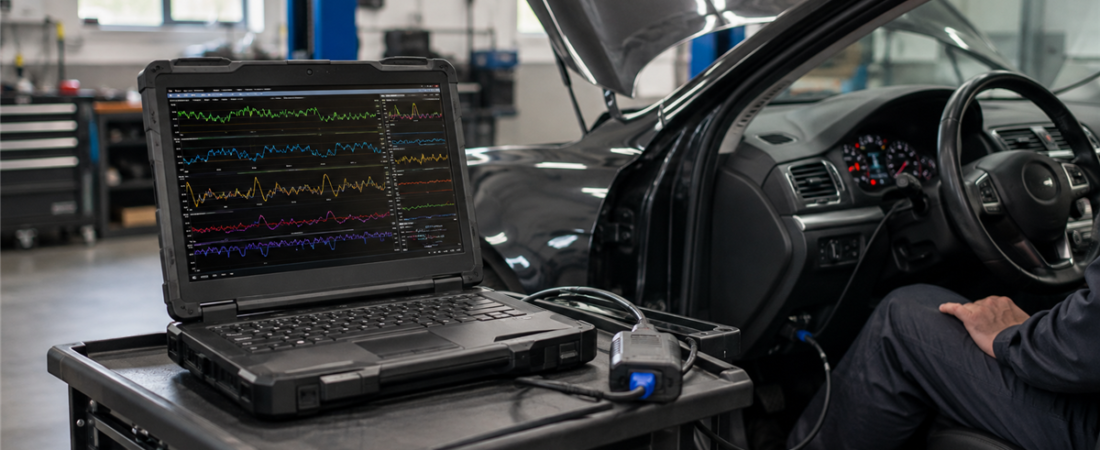
How to Read OBD2 Live Data: Fuel Trims, Sensor Values, and Common Warning Signs
A trouble code tells you which system noticed a problem; OBD2 live data helps you see what the engine is doing right now. Instead of replacing the part named in a code description, you can watch the relevant sensor values, compare related parameters, and test whether the data changes logically as operating conditions change.
Learning how to read OBD2 live data is one of the best ways to turn a basic scan tool into a useful diagnostic instrument. The goal is not to memorize one perfect number for every vehicle. It is to establish the correct test conditions, compare values that should agree, and look for patterns. If you are new to scan tools, read our beginner’s guide to OBD2 diagnostic software first.
What OBD2 Live Data Actually Shows
Generic OBD2 live data is standardized emissions-related powertrain information requested from the vehicle. SAE J1979 identifies current powertrain data as a regulated diagnostic service, while the current SAE J1978-1 scan-tool standard describes how a compliant tool accesses those services. Typical parameters include engine speed, coolant temperature, calculated load, fuel-system status, fuel trims, airflow, manifold pressure, throttle position, and oxygen or air/fuel sensor readings.
Not every vehicle supports every parameter, and generic OBD2 is only the common baseline. Transmission, ABS, airbag, body, hybrid, and manufacturer-specific engine data may require enhanced software and a compatible interface. Our diagnostic interface comparison explains why a basic ELM327 and an OEM VCI can show very different amounts of data.
Prepare the Vehicle Before Judging the Numbers
A cold engine, active warm-up enrichment, electrical loads, or a regeneration event can make healthy data look suspicious. Use a repeatable baseline:
- Confirm the battery is healthy and connect the scan tool with the ignition off unless its instructions specify otherwise.
- Start the engine, check for stored and pending codes, and save freeze-frame data before clearing anything.
- Warm the engine fully. Confirm coolant temperature rises smoothly and the fuel system enters closed loop on a gasoline engine when conditions allow.
- Turn off unnecessary loads, let idle stabilize, and record a short baseline.
- Select only the PIDs needed for the test. Fewer channels usually produce a faster, easier-to-read graph.
If the tool cannot establish communication, solve that first using our no communication troubleshooting guide.
How to Interpret Short- and Long-Term Fuel Trim
STFT: the immediate correction
Short-term fuel trim, or STFT, is the control system’s rapid response to feedback from the exhaust sensors. A positive number means the ECU is adding fuel because its feedback indicates a lean tendency. A negative number means it is removing fuel because the mixture appears rich. STFT normally moves as load, injector commands, and sensor feedback change; a perfectly fixed value is not automatically better.
LTFT: the learned correction
Long-term fuel trim, or LTFT, is the learned correction retained over a longer period. It changes more slowly and shows how much compensation the ECU has adopted. On a fully warm, stable gasoline engine, values near zero generally mean little correction is needed. As a practical screening rule, totals within roughly plus or minus 5 percent are often unremarkable, while correction around 10 percent or more deserves comparison with the manufacturer procedure, operating condition, and the opposite bank. These are guides, not pass/fail specifications.
Consider STFT and LTFT together for each bank. If STFT is +8 percent and LTFT is +12 percent, the ECU is currently adding about 20 percent fuel under that condition. Ford service guidance likewise uses the sum of short- and long-term trim when diagnosing mixture faults.
Use load changes to narrow the cause
- Positive trim mainly at idle: suspect unmetered air, such as a vacuum or intake leak. If correction improves clearly at 2,500 rpm, the leak becomes a stronger possibility.
- Positive trim at idle and under load: investigate low fuel delivery, incorrect airflow measurement, an exhaust leak ahead of the sensor, or another condition affecting the entire operating range.
- Negative trim: look for excessive fuel pressure, a leaking injector, purge flow at the wrong time, or biased airflow and exhaust-sensor data.
- One bank differs from the other: focus on components unique to that bank before blaming a shared fuel supply or airflow sensor.
Sensor Values Worth Watching Together
| Parameter | Healthy pattern | Warning sign |
|---|---|---|
| Coolant temperature | Rises smoothly from close to ambient after a cold start | Implausible starting value, sudden jumps, or never warming normally |
| Intake-air temperature | Reasonable for under-hood conditions and changes gradually | Extreme fixed value suggesting an open circuit, short, or default substitute |
| MAF or MAP | Responds smoothly when throttle and engine load change | Dropouts, flat response, or a value inconsistent with RPM and load |
| Throttle position | Moves progressively with pedal input where supported | Dead spots, sudden spikes, or disagreement between related channels |
| Oxygen or air/fuel sensor | Responds to mixture changes after warm-up | Stuck, slow, or contradictory response alongside persistent trim correction |
| Control-module voltage | Stable and appropriate for the vehicle’s operating state | Dropouts that coincide with resets or communication faults |
Always ask whether the value makes physical sense. Before a cold start, coolant and intake temperatures should be broadly similar to the surrounding temperature. If coolant reads extremely hot on a cold engine, do not assume the engine is overheating; inspect the sensor circuit and connector. Likewise, a smooth-looking airflow value may still be wrong if it does not agree with engine speed, load, manifold pressure, and fuel trim.
A Practical Five-Minute Live-Data Test
- Graph RPM, coolant temperature, closed-loop status, STFT, LTFT, and MAF or MAP.
- Record 30 seconds at warm idle with all accessories off.
- Hold about 2,500 rpm for 20 to 30 seconds and compare fuel correction with idle.
- Briefly open and release the throttle while stationary. Confirm airflow, load, throttle, and RPM respond in the expected order without dropouts.
- If the symptom occurs only on the road, record the session and review it afterward. Use a second person to operate the tool; never watch a laptop while driving.
Capture the exact moment the symptom occurs, then compare it with freeze-frame data and known-good behavior. One odd sample can be a refresh delay. A repeatable relationship between several parameters is much stronger evidence.
Common Mistakes That Lead to Wrong Conclusions
- Condemning an oxygen sensor because its voltage moves without checking whether it is a conventional sensor or a wideband air/fuel sensor.
- Judging fuel trim during cold start, deceleration fuel cut, heavy accessory load, or another unstable condition.
- Clearing codes before saving freeze-frame and baseline data.
- Assuming a generic PID tells the whole story when OEM data provides a commanded value, actual value, or adaptation limit.
- Replacing the sensor that reports the problem instead of testing the system that influences it.
Final Takeaway
To read OBD2 live data well, control the test conditions, graph a small group of related PIDs, and compare patterns rather than chasing isolated numbers. Fuel trims show the correction the ECU is making; temperatures, airflow, pressure, throttle, and exhaust feedback help explain why. Save the evidence, change one condition at a time, and confirm the repair with the same test that exposed the fault.
 English
  German
  Spanish
  Italian
  French
  Hebrew
  Dutch
Dutch  Finnish
  Norwegian
  Swedish
  Polish