
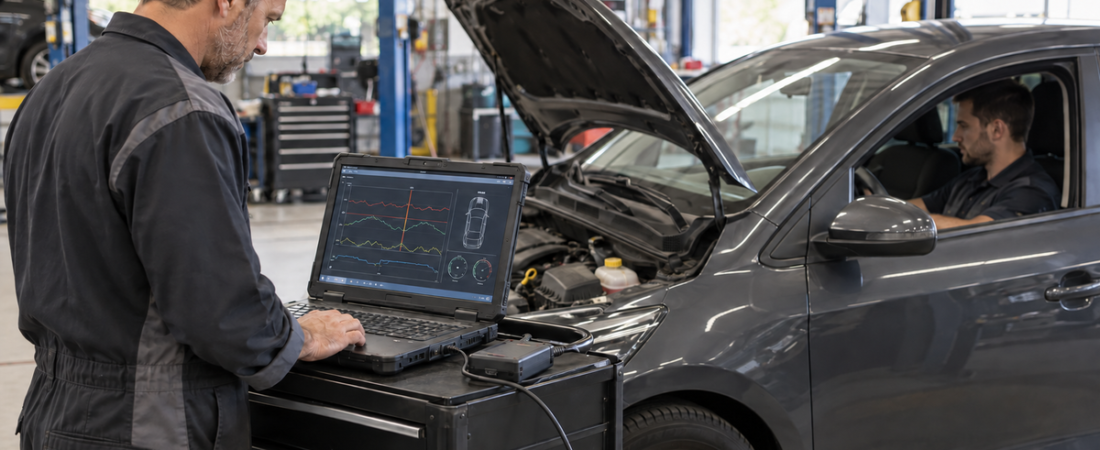
Intermittent vehicle faults are difficult because the symptom often disappears before the car reaches the workshop. It may occur only during a cold start, on a hill, or after the cabin warms up. Replacing parts from the code description alone usually wastes time.
The better approach is to preserve the conditions that existed when the fault appeared, then use live data to recreate and test those conditions. This guide explains how to diagnose intermittent vehicle faults with freeze-frame data, focused data logging, and repeatable tests.
Freeze-Frame Data vs Live Data
Freeze-frame data is a snapshot of selected operating values stored when an OBD fault is detected. It may include engine speed, load, coolant temperature, vehicle speed, fuel status, fuel trims, airflow, throttle position, and fuel pressure. EPA material describes it as useful evidence before repair.
Live data is the continuously updated stream available while the vehicle is running or the ignition is on. It lets you watch a value change, graph multiple signals together, and record a road test. Freeze frame tells you where to begin; live data helps you reproduce the event and test the suspected cause.
Generic OBD data follows standardized services such as SAE J1979, but available parameters vary. Manufacturer software may add misfire counters, command states, voltages, and network status.
Step 1: Capture the Driver’s Description
Convert the driver’s complaint into reproducible conditions. Ask about engine temperature, speed, load, fuel level, weather, road surface, selected gear, accessories, and warning lights.
- Does it happen on the first start, after a hot soak, or after a long drive?
- Is the event tied to acceleration, cruising, braking, turning, or bumps?
- Does rain, high humidity, or freezing temperature make it more likely?
- Did any recent repair, battery replacement, or accessory installation precede it?
- Can the driver provide a time, route, or dashboard photo?
Write these details on the repair order. They become the test plan rather than background conversation.
Step 2: Preserve All Diagnostic Evidence
Perform a complete pre-scan before clearing anything. Record confirmed, pending, history, and permanent codes from every module. Note warning-light commands, readiness, battery voltage, and network codes.
Do not disconnect the battery or clear DTCs before saving freeze-frame data. EPA guidance warns that codes and associated freeze-frame information are important for diagnosis, and emissions-related information may be erased together when a clear command is issued. Our guide to P, B, C, and U trouble codes explains how code families and status affect the next test.
Step 3: Read Freeze Frame for the Triggering Code
Open freeze frame and identify the DTC associated with the snapshot. Some vehicles retain only one generic frame, often for the first or highest-priority emissions fault, while enhanced software may provide more records. Save a screenshot or report before continuing.
Translate the numbers into a driving condition. For example, 2,800 rpm, 58 percent load, 52 mph, and closed-loop control suggest a warm loaded cruise. Coolant near ambient points toward a cold start. High fuel trims under load suggest a different direction than high trims only at idle.
Check whether values are plausible before interpreting them. A coolant reading far below ambient, a fixed throttle value, or zero vehicle speed during a reported highway event may indicate a sensor or data-support issue.
Step 4: Build a Focused Live-Data List
Do not graph every parameter. A large PID list can reduce the update rate and hide a short dropout. Choose the smallest group that tests the hypothesis. Our guide to OBD2-Echtzeitdaten auslesen covers fuel trims and comparison techniques.
A useful list for a lean-code complaint might include engine speed, load, short- and long-term fuel trim, upstream oxygen or air-fuel sensor response, mass airflow, manifold pressure, throttle position, and commanded fuel state. For an electrical dropout, log system voltage, module supply voltage when available, ignition state, and communication counters.
Step 5: Reproduce the Conditions Safely
Match the freeze-frame condition as closely as practical: similar coolant temperature, speed, load, gear, and accessory use. Use the scan tool’s recording function so the driver can focus on the road. A second technician should operate a laptop when manual interaction is necessary.
- Verify tires, fluids, battery condition, and that the vehicle is safe to drive.
- Start recording before the expected event, not after the warning appears.
- Follow a planned route that can safely reproduce the speed and load.
- Use an event marker or record the exact time when the symptom occurs.
- Return to the workshop and save the log before changing the setup.
Never watch graphs while driving. If the fault requires unsafe speed or involves braking or steering, use a controlled test environment or stop.
Step 6: Compare Signals, Not Isolated Numbers
Intermittent faults often appear as a broken relationship. Airflow should respond as throttle and load rise. Intake-air and coolant temperatures should be close before a cold start. Voltage should not collapse when several modules report communication loss.
Graph related values on the same timeline and look just before the event. A one-second sensor dropout may trigger a longer period of rough running, so the earliest abnormal signal is usually more useful than the values recorded after the control system reacts.
Three Practical Diagnostic Examples
Lean Code That Appears on Hills
Freeze frame shows high load and positive fuel trim at highway speed. Recreate the load while logging trims, airflow, manifold pressure, and fuel-pressure data if supported. Trims that worsen mainly at high load point toward fuel delivery or under-reported airflow; trims that are highest at idle more often direct attention toward an intake leak.
Misfire After a Hot Soak
Record coolant temperature, rpm, injector command, oxygen-sensor response, and manufacturer-specific misfire counters during restart. Compare cylinders and inspect ignition or injector behavior only after identifying which counter rises first.
Random Communication Warnings
Save the full module scan and note which modules report U-codes. Log voltage and network status, then inspect shared power, grounds, connectors, and harness areas. If the diagnostic link itself drops out, use our no-communication troubleshooting sequence.
Use Controlled Tests in the Workshop
When a road test identifies the conditions but not the component, reproduce one variable at a time. A careful harness wiggle test, connector voltage-drop test, heat or cooling test, smoke test, or controlled electrical load can expose the failure. Watch the relevant live signal while testing and stop if a procedure could damage a circuit.
Do not condemn a sensor because one graph looks unusual. Confirm power, ground, signal integrity, mechanical conditions, and service information. The scan tool reports what the control module sees; it does not automatically identify why the value is wrong.
Confirm the Repair
After the repair, clear codes only when appropriate, then repeat the same route or controlled test under conditions close to the original freeze frame. Confirm that the symptom is gone, related signals remain plausible, monitors can run, and no pending code returns. Save the post-scan and final data log with the repair record.
 English
  German
  Spanish
  Italian
  French
  Hebrew
  Dutch
Dutch  Finnish
  Norwegian
  Swedish
  Polish